Google and parabolic moves

You guys know I’m in a patient holding pattern right now. No Trades for me so far today.
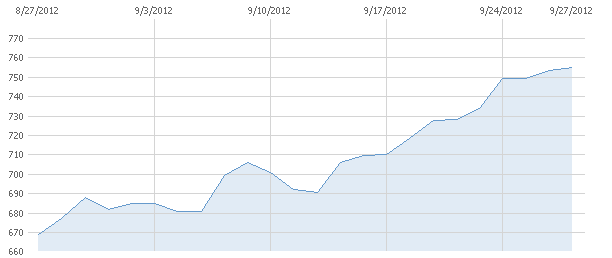
I got just about one red stock on my screen this morning and that one is named Google. Probably not a bad thing to let that stock breathe a little bit. Look at this one month chart from Google:

I have written before about the term parabolic. I though it would be enlightening to refresh your memory.
Parabolic –
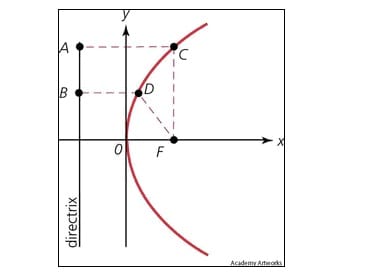
“Parabolic” according to the standard dictionary is defined as “Of or having the form of a parabola or paraboloid.” A parabola is “A plane curve formed by the intersection of a right circular cone and a plane parallel to an element of the cone or by the locus of points equidistant from a fixed line and a fixed point not on the line.” Here’s a picture of a parabola:

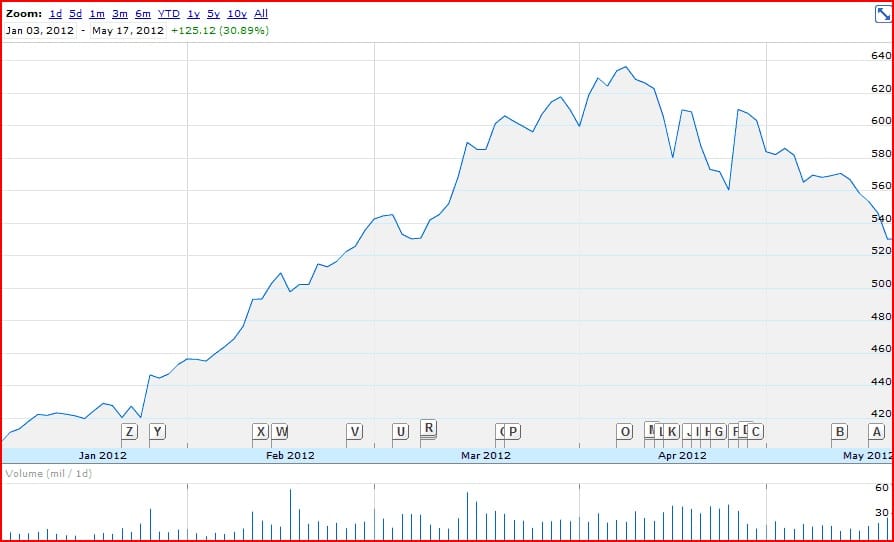
Now the way this all relates to a stock is that you should look at a stock chart and pretend that the intersection of the axis themselves are the start of the chart and you see that Apple’s weekly stock chart looks a little bit “parabolic”.

Source: Google Finance
At any rate, the main idea behind “parabolic moves” is that they are unsustainable because the stock has run up so much so fast that profit takers, shorts, bears, and worry warts are going to sell simply as a function of the stock having run up so much so fast, making it a self-fulfilling prophesy. I’m not a “technical analyst” or a “chartist” because I don’t draw lines on stock charts to make my trading decisions, but common sense itself tells you that when Apple’s gone from $380 to $540 in a few months’ time, that people like you and me are going to do a little selling ourselves and that too can self-fulfill that prophesy.


